What is a body measurement chart?
A body measurement chart is a simple table: body parts down the side, dates across the top. Each measurement session fills one column, and comparing columns shows you exactly how your body is changing — independently of the scale, which mixes fat, muscle and water into one noisy number. It's the oldest progress-tracking tool in fitness, and it still works.
The essential rows
Start with the four measurements that matter for almost every goal:
- Weight — the context number, best read as a weekly trend.
- Waist — the single most informative measurement for fat loss and health.
- Hips — the widest point around your glutes; with waist, it gives your waist-to-hip ratio.
- Chest — at nipple height, tape level; tracks both fat loss and upper-body muscle.
Then add rows for your goal. Building muscle? Add biceps (left and right), thighs (left and right), calves and shoulders. Left and right matter — arms and legs rarely grow identically, and a chart that averages them hides imbalances. Watching overall leanness? Neck is a useful extra that also feeds some body-fat estimation formulas.
Free body measurement chart template
Copy this table into a document, print it, and stick it wherever you measure. The rows run top of the body to bottom on purpose — measuring in order means you never skip a spot.
| Body Part | Where to Measure | Date 1 | Date 2 | Date 3 | Change |
|---|---|---|---|---|---|
| Neck | Just below the Adam's apple, tape level | ||||
| Shoulders | Widest point, around both deltoids | ||||
| Chest | At nipple height, tape level, normal exhale | ||||
| Biceps (L / R) | Widest point of the upper arm, flexed or relaxed — same choice every time | ||||
| Waist | Narrowest point of the torso, above the belly button | ||||
| Hips | Widest point around the glutes | ||||
| Thighs (L / R) | Widest point of the upper thigh | ||||
| Calves (L / R) | Widest point of the calf, standing | ||||
| Weight | Same scale, morning, before breakfast |
Fill it in every week under identical conditions — same day, same time of morning, bare skin, relaxed. Exact tape placement for each spot is covered in how to take body measurements.
The honest downside of paper charts
A printable chart gets you started, but it has real limits you'll hit within a month:
- No trends. Six columns of numbers don't show you a direction — you have to squint and do mental math for every delta.
- No reminders. The chart can't tell you it's measurement day; missed weeks leave holes in your data.
- Easy to lose. Three months of progress data on a sheet of paper stuck to the bathroom mirror is one cleaning day away from gone.
- Change column by hand. Subtracting Date 7 from Date 1 across nine body parts, every week, is exactly the kind of friction that kills tracking habits.
The app IS the chart — automated 📋
The Body Measurement Tracker app is this exact chart, minus every downside: log your measurements in one quick form, and it auto-calculates every change, draws an interactive chart per body part, and shows your 30-day trend and all-time delta at a glance. A weekly reminder replaces the sticky note, and your data lives safely on your phone instead of a sheet of paper. Free on iPhone and Android.


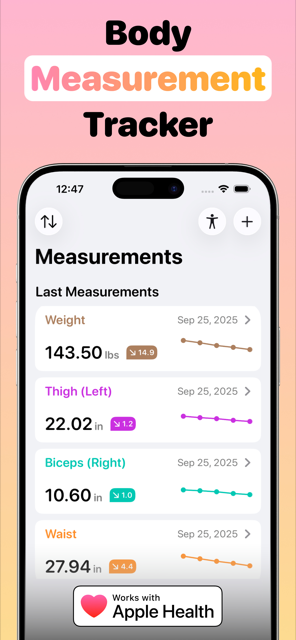
Chart in hand — now what?
Two things make any chart, paper or digital, actually useful: measuring the same spots every time and measuring on a consistent schedule. Start with the waist — it's the highest-value row on the whole chart — using the exact waist measurement technique, and set your cadence with how often to take body measurements.